Australian Coking Coal Futures
Let’s start with what used to be the most import index for the met market, the Australian Coking Coal Futures. I use data from Barchart.com, link here.
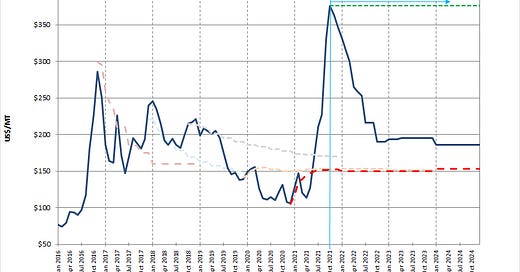
This chart shows the approximate settling price of each monthly contract as well as the current forward prices for each future contract. For the noobs, these are not my projections, these forward prices are actual prices which market participants are transacting future contracts at today.
The green dashed line is the current price, $376/mt as of early October. The forward curve is steeply backwardated. That is, future contracted prices are less than today’s price. I wrote about the futures curve here, a few months ago, and explained that the forward curve tends to hug the global average cost of approximately $150/mt. You can also see the evidence of this phenomena by comparing the forward curves at the end of each year in the chart above. The fact that forward prices are currently leveling off around $190/mt suggests to me the notion that the marketplace is realizing Chinese high quality coking reserves are dwindling fast, as evidenced by the disappointing supply response to this years severe shortage. This perhaps could raise expectations of average costs from $150/mt to $190/mt.
Another interesting metric I like to watch is the 12 month forward price, refer to the yellow line in the chart below:
Current 12 month forward prices are banging up against their all time highs. This suggests that although we’re in a severe supply crunch, market participants believe high prices will cure high prices and a associated supply response is forthcoming. As long as the Chinese ban on Australian coal is in place, I do not see a significant supply response in the near to medium term, at least for the premium blends. The Aussies are the only geography that could really mount a material high quality coking coal supply response, and as long as the ban is in place their supply will not reach the place it is desperately needed - China.
Chinese CFR
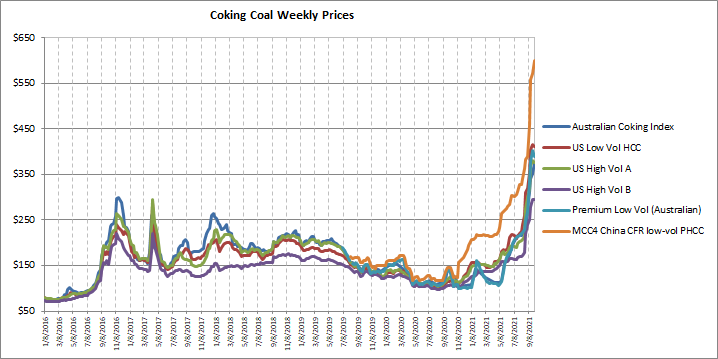
Chinese CFR prices are pulling global prices higher. The supply crunch is in China, it’s not really a global phenomena. But China produces roughly 50% of the world’s crude steel, and more if we’re thinking in terms of basic oxygen furnace (BOF) steel, of which coking coal is required/utilized. Therefore, a supply crunch in China equals a supply crunch for most of the global steel producing industry. Here’s a chart of the Chinese CFR prices along with other indexes:
The spread between global indexes began widening on the implementation of the Chinese ban, and Chinese CFR prices have rallied non-stop ever since. Here’s a longer term perspective:
From here lets take these various indexes and use the Australian Coking Coal’s forward curve to imply a forward for each index:
Netback Estimates
Now let’s talk about netback prices. Netbacks are the price that the coal producer gets after all transportation expenses and discounts are applied, it’s the price FOB at the mine, typically the point where the coal is loaded onto railcars at the washplant. So in determining netbacks, we have to first consider inland freight (rail or barge) expenses, and transloading fees (cost to take the coal dumped from a railcar and put it on an ocean going vessel). For inland freight I typically estimate it at 20%-25% of the index, with a max of $40-$45. This is a bit high but it also covers transloading fees and any demurrage, which is happening a lot lately.
Depending on where the index is priced, being at the port or delivered, you may need to consider the ocean freight as well. Here’s a chart of ocean freight prices from various US ports and export destinations:
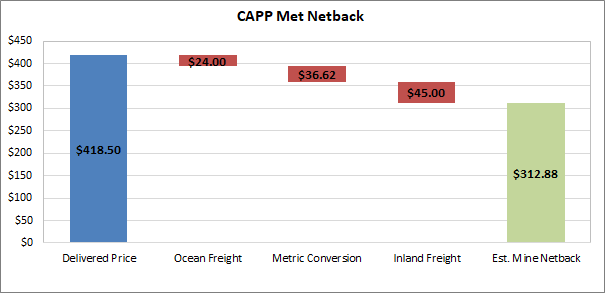
Below is a waterfall graph for an average CAPP producer for sales into Europe at current spot prices (averaging Low Vol and High Vol-A together):
And here is one for Low Vol CAPP exports to China:
Here’s a chart of estimated netback prices for Central Appalachia (CAPP), along with the Australian Coking Coal futures forward curve and implied forwards for the other indexes:
If you’re struggling to read these charts and determine what the annual averages are, refer to the table below:
Summary
The table above demonstrates what the current forward curve implies for average sales price (ASP) realizations going forward. For example, we could plug these forward ASP’s into the financial model for various US met producers in order to determine their current valuations. We could also use these ASP’s to estimate where the 2022 annual price contracts for US domestic buyers will be priced at.
Although current spot prices and associated netbacks are extremely high, forward curves remain steeply backwardated. Nevertheless, they imply FY 2022 figures that are well into the money for all US met producers. As we’ve seen in the cost comparison I provided in the Arch writeup, most met producers have cash mining costs in the $61-$85/ton range.
Estimated forward profit margins for Low Vol and High Vol-A producers are therefore above $100/ton. This should be eye opening for coal investors looking ahead into 2022.
If you’d like to follow along daily and get access to company deep dives, please consider subscribing using the button below.
If you liked this article please smash the like and share buttons. Thanks for reading!
Nothing in this Site constitutes professional and/or financial advice, nor does any information on this Site constitute a comprehensive or complete statement of the matters discussed or the law relating thereto. The author of this Site is not a fiduciary by virtue of any person's use of or access to this Site or it’s Content.


Hi Dyer, excellent content, thanks for sharing. Regarding HCC, the reference price for them is the australian coking Coal Index? If so, there is a great upside in revenues next quarter vs estimates (around 190) vs a back of the envelope calculation (1800 Tones * 250 Austr price = 450) I am missing something? seems nuts!
Why Cash Cost for HCC is only $65.28? Last quoters it was around $80.