


Comparing Coal Equities for 2022
A Chart and Statistical Review

Intro
This year has been eventful for the coal trade. We had a massive rally followed by a pullback which shook-out all of the weak hands and momentum traders (me). Only the most fervent followers of the fundamentals, or those with diamond hands have continued to hold. As the OG Coal Godfather himself tweeted recently in reference to ARCH:

Since the pullback coal futures have seemingly found a bottom and the equities have followed suit. The current setup has made me sit up and start paying close attention again. The following is a quick visual rundown of the situation so we can compare coal futures to producer equities as well as the equities to one another. This will hopefully add some forecasting value for the next stage of the coal trade.
Thermal Coal Futures
The following chart is of Newcastle Coal Futures all the way back to 2009:

Take note of the 2010/11 cycle high of $138/mt and the 2018 cycle high of $120/mt. Prices in 2021 rallied to obscene levels, twice the previous cycle high. More importantly however, is where forward prices rebounded from during the recent pullback.
Refer to the chart below:

The back-end of the term structure, Dec’22 through Dec’25, bounced at $100/mt. Relative to historical norms, a floor of $100/mt is a very healthy level for seaborne thermal coal production. This suggests to me the current cycle is not over and the runway for healthy prices has a long ways to go, probably measured in multiple years left. The setup for thermal futures to retest the highs in 2022 is a definite possibility.
Thermal Coal Equities
In terms of thermal producers we have those with significant seaborne exposure and those without, see below:
Ranked in order of seaborne exposure significance:
Whitehaven Coal (WHC.AX)
New Hope Corp (NHC.AX)
Thungela Resources (TGA.LSE)
CONSOL Energy (CEIX)
Adaro Energy (ADRO.JK)
Peabody Energy (BTU)
Alliance Resource Partners (ARLP)
Hallador Energy (HNRG)
Now lets compare each of the above along with Newcastle Futures:

The chart above is definitely messy, but it allows you to visually see the producers which underperform and also the ones which fly-high when the sector is rallying.
BTU seems to get all the attention and it’s probably due to it’s volatile nature and the trading potential therein however, it suffers fairly dramatic drawdowns and isn’t easy to hold for the full cycle. This makes it difficult to capture the outsized returns offered by such volatility.
Reward equals risk, so let’s normalize in them in terms of Sharpe ratio to see how each compares:

BTU has the largest average monthly return for the test period, at 18%, but also has the highest monthly price volatility, at 31.8% (measured in standard deviation). The resulting Sharpe is more or less middle of the pack.
As suspected, ARLP has the highest Sharpe ratio and has been the easiest to hold throughout the rally from a “diamond hands” perspective. CEIX is ranked second in terms of Sharpe but its recent performance has unquestionably lagged the group, which makes me wonder what’s going on with it from a fundamental standpoint.
TGA is the recent outperformer, and is the only thermal producer which bottomed prior to the seaborne futures bottoming. I view this as a good sign and is the primary reason I’ve owned TGA throughout the pullback.
Lastly, it’s hard to look at the comparison chart without thinking BTU is going to make another run for it. With that in mind I’d like to refer everyone back to my easy algorithm for trading BTU, posted on Oct. 29, 2021:


I’ve spoken to many people on Twitter who would’ve saved a lot of heartache and money if they had followed the very simple approach in that tweet.
Metallurgical Coal Futures
The following chart shows Australian Coking Coal Futures (FOB Queensland):

The recent cycle high blew past $300/mt and approached $400/mt before stalling out this winter. The recent bounce is mostly due to heavy rains and flooding in Queensland but the entire term structure bounced along with the front-end, which suggests there’s more to the supply/demand story than simply short term weather.
If we look at monthly data for each met index I track, it’s apparent that China CFR prices really drove the 2020/21 rally to extremes due to supply shortages. To date, those prices have not bounced similar to the FOB Queensland price in the previous chart, see below:
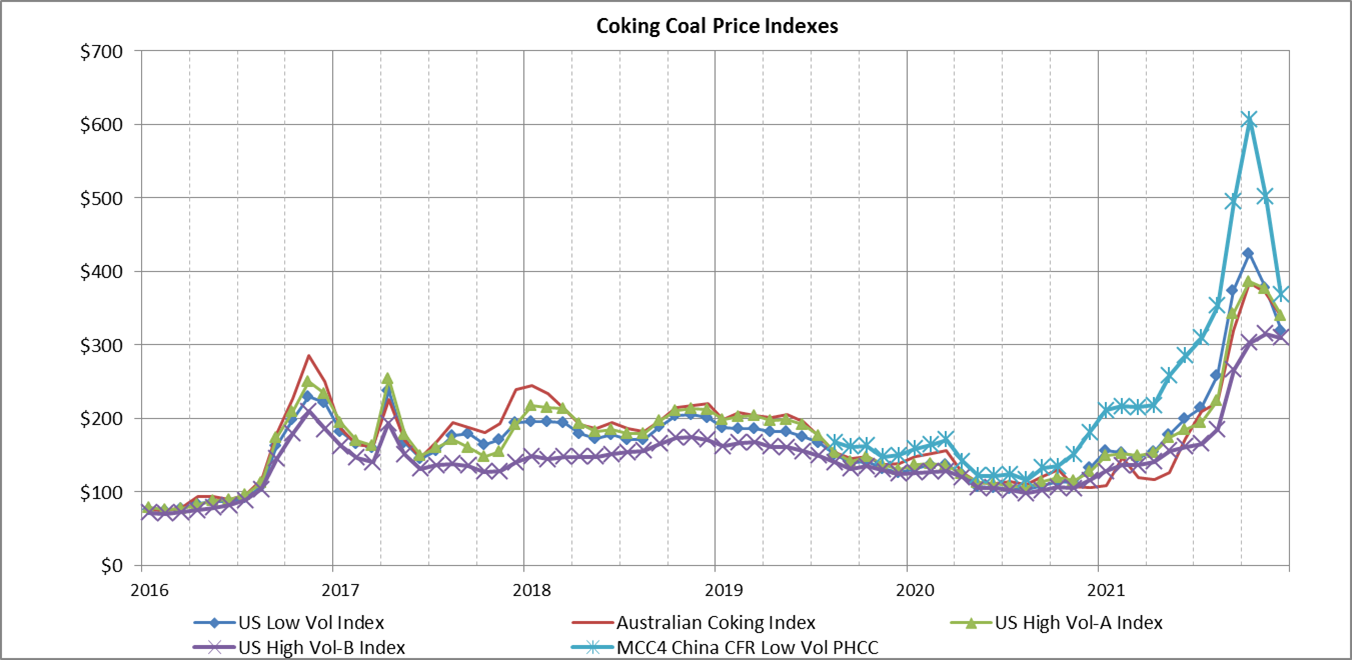
The pullback in China CFR prices is due to the following, ranked in order of importance from my perspective:
Australian coal being held in trade war purgatory being released.
Chinese steel production paused during the winter.
Mongolian imports increased marginally due to Covid border closings being relaxed somewhat (prior to omicron).
The important question going forward is, will the supply shortages reemerge once the Chinese begin ramping up steel production in March through May. The magnitude of the Chinese ramp-up will be important, as well as the Mongolian border situation at that time. Below is a chart of Chinese steel production (source):
Chinese Steel Production

This winter's pause as been more drastic than usual and begs the question of whether the rebound will get back to recent highs or not. Regardless of the magnitude of the ramp, we know that it will ramp and the marginal demand for high quality coking coal will therefore increase worldwide in March, April and probably May. The incremental demand during this period will likely outstrip incremental supply and we’ll therefore get to see if global shortages reemerge.
Regardless, the 2022 calendar year should provide a robust price environment for met producers. The risk is a Chinese led recession and associated steel demand destruction which would cause a met price collapse. So know your risk.
Metallurgical Coal Equities
Similar to the thermal names, there is once again a low quality and high beta relationship when it comes to met producers. ARCH and HCC are largely thought to be the high quality names whereas AMR, METC and CRN are thought to be of lower quality. I don’t really buy that viewpoint too much, generally categorizing AMR as a straight up ARCH peer. There’s also CRN, which is probably the lowest quality of the group, but has one of the best mines in N. America, that being the Buchanan Mine. So each has their unique qualities, but overall ARCH is the most beloved in the circles where I discuss stocks.
Here’s a chart comparing each met producer to the futures:
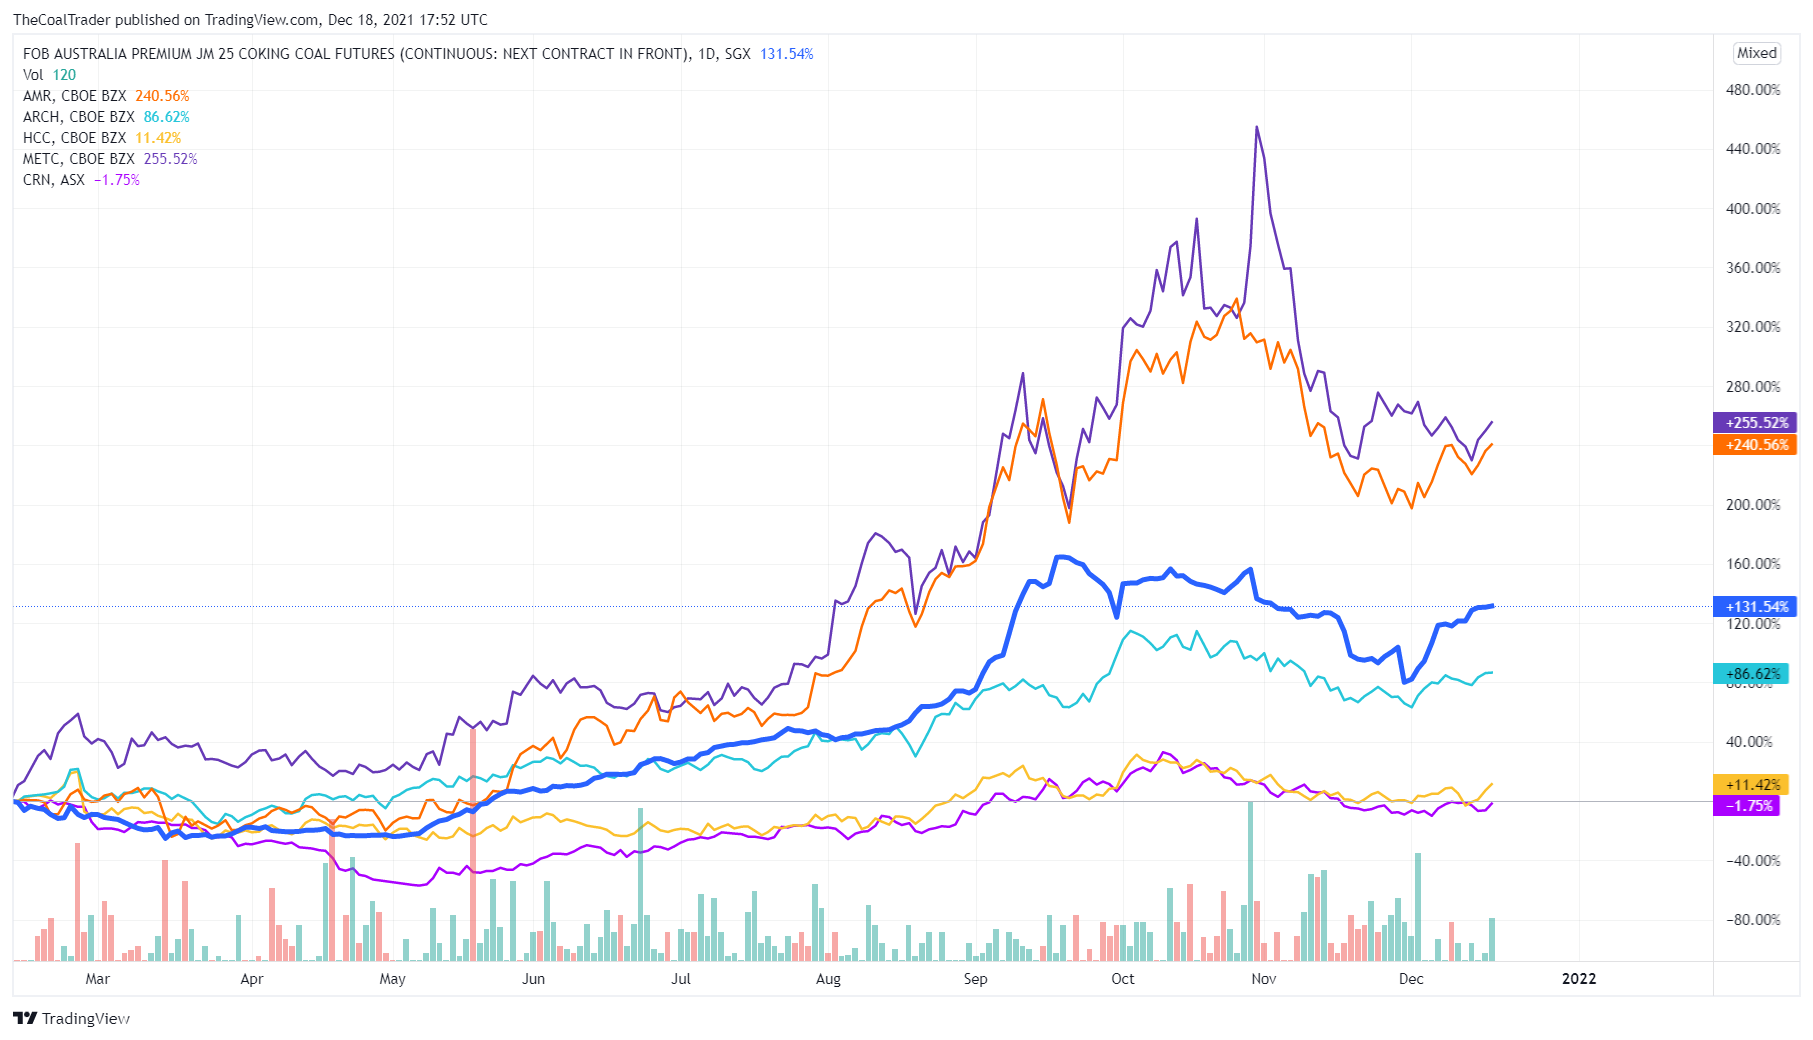
AMR and METC are the high beta outperformers, but let’s normalize on Sharpe again for comparison:

This table demonstrates that you’re not really getting the return for the risk (standard deviation) on ARCH, much less any of the met producers with the exception of AMR. Of course the results may change by changing the test period analyzed, but we’ve captured the rally and the pullback in this analysis so I think it’s fairly representative.
You could also make the argument that AMR was the most bombed-out to begin with and therefore had the most catching up to do, but even over the most recent two month period, AMR has outperformed ARCH, although only slightly.
Summary
It’s definitely time to sit up and take notice of coal equities again. The 2021 rally was substantial and depending on which producers you were invested in, likely depended on if and when you got shook out, and how much of the total performance you were left with after the pullback.
Going forward I recommend thinking in terms of reward vs risk and picking a horse which you can stick with for the long(er) haul, as opposed to simply picking the highest beta horse.
If you’re interesting in learning more about the coal sector and digging into the fundamentals of each producer, you may want to subscribe below. By subscribing you’ll get access to the full archive and also be able to track my personal portfolio which is currently up around 250% since I started this substack in July. You’ll also be able to read my commentary on a daily basis. So consider smashing the button below:
I also enjoy any and all feedback and questions, so I urge you leave a comment.
Nothing in this Site constitutes professional and/or financial advice, nor does any information on this Site constitute a comprehensive or complete statement of the matters discussed or the law relating thereto. The author of this Site is not a fiduciary by virtue of any person's use of or access to this Site or it’s Content.