This article will review the Australian coking futures since 2016 and study how the forward curve reacts to spot price rallies and sell offs. The implications should reveal how to interpret the current rally and also gauge how meaningful the forward curve is for forecasting.
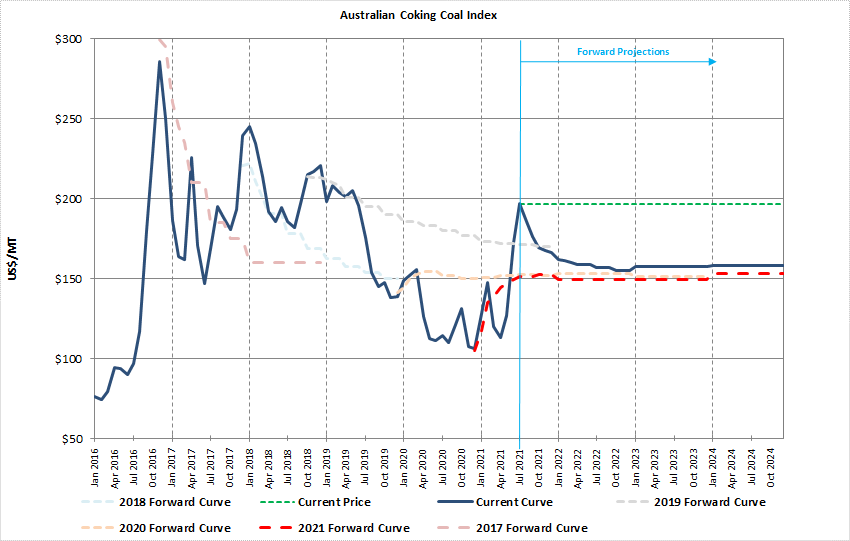
Let’s start with a basic chart of the Australian Coking Coal Index going back since 2016 when I started closely tracking and recording the price data. This chart is basically my own construction of what a continuous contract for this product would look like. As you can see in July 2021 the chart switches from actual historical prices to forward prices based on the current price of each monthly futures contract going out through 2024:
I like to view the current price ($197/mt) as a horizontal line (green dashed above) in order to easily see the shape of the forward curve and the gap or spread in between spot (current) prices and forward contracts.
Most commodity investors and traders typically view the forward curve of most products as the “best guess” or consensus for forecasting future prices since those forward contracts represent various market participants’ views on the future. I typically agree with this generalization for most commodities and I used to view coking coal futures in a similar fashion, lately however I’ve been shifting my thoughts to a new view which I will discuss later in this article.
Now that I’ve introduced the basic chart, I will now introduce another chart with some additional pieces of information:
The chart above shows the forward curve as it stood towards the end of each calendar year from 2016 through 2021. For example, in late November 2016 when coking prices hit a high of approx $300/mt, the forward price of July 2018 coking coal was $160/mt.
The 2019 forward curve could be described as the most bullish, having the least amount of backwardation: from $213/mt in December 2018 to around $180/mt for July 2020. Unfortunately for anyone long the July 2020 contract, Covid came along and crushed prices down to settle around $110/mt. Then, towards the end of 2020 forward prices for July 2022 were back to around $150/mt.
As you can hopefully see, no matter how high or low spot coking coal prices get, the forward curve consistently points back towards the $150-160 level. How do we explain this?
I believe market participants are simply buying forwards near the global avg. cash cost, which is widely believed to be in the $150/mt range.
Let’s view one more chart which perhaps makes the visual easier. I’ve constructed a synthetic 12 month forward continuous contract, shown in yellow/orange below:
Since the rally in 2016, 12 month forward prices have pretty much hugged a range from $130-160/mt, with the exception of 2018 and early 2019 when every marginal producer was finally up and running (implying a higher global avg. cost). What I’m saying is that every mom and pop producer with high mining costs and relatively higher barriers of entry finally got things going in 2018, which was a full year after the late 2016 price signal.
Fast forward to present day and the positive price signal is occurring now. However, the marginal producer today is arguably faced with harsher barriers to entry compared to the 2017-2018 period. Capital lending, workforce availability, and logistics availability are but only a few of the numerous constraints placed on the coal industry in today’s environment. It’s easy to argue that all things being equal, it should take longer this time around for supply to respond to higher prices.
For US based met coal production, MSHA just reported that Q2 production was 5.5% less than Q1. This is a sign that either producers aren’t taking the price signal seriously, which could be the case given the Chinese Australian coal ban skewing prices for over a quarter, or more seriously, that producers were simply unable to ramp production.
With forward prices currently in the $155-160 range, I believe that the forward curve is mispriced.
I’ve personally never met anyone in the industry who utilizes the futures for actual hedging, my inclination is that they’re probably only used by coal trading firms like XCoal or perhaps the big producers like BMA in Australia. These companies are therefore not really “missing the plot” but more likely simply utilizing the futures markets to hedge whatever price risks are unique to their situation.
The forward curve in my opinion is therefore NOT a good forecaster of future coking coal prices. It is instead perhaps a good gauge of the global avg. cost of coking coal production. Furthermore, since use of coking futures markets is probably limited and used uniquely by only a few companies/participants, there are probably profitable arbitrage opportunities for those comfortable dabbling on futures exchanges. For those not comfortable trading futures, going long equities of coking coal producers is a simple way to get leveraged exposure to higher prices above and beyond where the forward curve is predicting.
There are risks of course, Chinese steel demand could be peaking now and as a result the forward curve could be correct this time around. But that is for another discussion and I look forward to sharing my thoughts on that as well. Lastly, I’d just like to say that it’s good to be back from vacation - I always find the beach extremely motivating, in a variety of ways.


Great analysis, thanks for sharing your thoughts. Keep them coming!
Thanks for sharing your analysis! Quick question for you. Can coal producers take advantage of high spot prices by hedging the price of coal. I'm thinking of Thungela Resources in SA. They are printing FCF at the current spot price and could lock in a very high profit this year by entering into a contract to sell its coal at the futures prices. Is there any reason it wouldn't do this?